Content Distribution Metrics: What Should You Measure?
Measuring content distribution requires more than counting views. Learn which metrics matter for short-form campaigns, how to evaluate creators and clips, and how Pervasive Clipping turns performance data into campaign decisions.
Pervasive Clipping Team
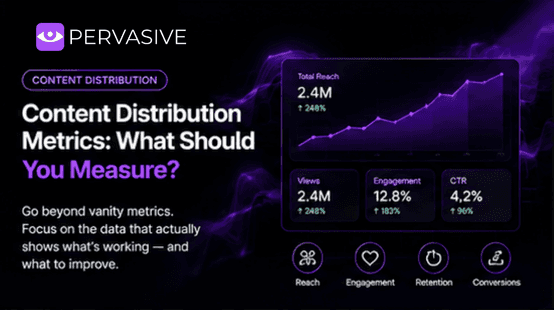
Content Distribution Metrics: What Should You Measure?
Views are easy to understand.
That's exactly why they can become dangerous.
A campaign can generate millions of views while providing little useful information about what actually worked.
At Pervasive Clipping, we treat performance data as a decision-making tool.
The objective isn't to produce impressive numbers.
It's to understand why the campaign performed the way it did.
1. Publishing volume
Start with the simplest metric:
How much content was actually distributed?
Track:
clips produced;
clips published;
creators active;
platforms used.
This gives you the baseline.
2. Views
Views provide a useful measure of exposure.
But views should be analyzed alongside context.
Ask:
Which clips generated them?
Which creators?
Which topics?
Which platforms?
Over what period?
A total number without context tells you very little.
3. Engagement
Engagement can include:
likes;
comments;
shares;
saves;
other platform interactions.
Engagement helps indicate whether the audience did something beyond watching.
4. Performance by creator
If your campaign uses a creator network, creator-level performance becomes extremely useful.
You can identify:
consistent performers;
high-volume creators;
niche performers;
creators whose audiences respond to specific topics.
This helps inform future distribution.
5. Performance by topic
This is one of the most strategically valuable metrics.
Suppose you publish content about:
entrepreneurship;
marketing;
productivity;
AI.
If marketing consistently generates stronger results, that may influence future clipping decisions.
The data starts informing the editorial strategy.
6. Performance by hook
The opening of a short-form video matters.
Track which opening structures perform better.
For example:
direct question;
controversial statement;
surprising fact;
personal story;
strong claim.
Over time, patterns emerge.
7. Retention
Where available, retention metrics help you understand whether the content holds attention.
A high view count with weak retention may tell a different story from a clip that consistently keeps viewers engaged.
8. Distribution efficiency
A campaign should also consider how much output is being generated relative to the resources invested.
You can evaluate:
cost per published clip;
cost per view;
creator efficiency;
production efficiency.
These metrics become particularly useful when deciding whether to scale.
The biggest measurement mistake
The biggest mistake is treating every metric independently.
The real value comes from connecting them.
For example:
Creator A + Topic X + Hook Y → strong retention + strong views
That is actionable.
“5 million views” is much less actionable.
How Pervasive Clipping uses data
We don't want reports that simply look good.
We want information that helps answer:
What should we create more of?
Which creators should receive more assets?
Which topics should be prioritized?
Which formats should change?
Where is distribution working?
Where should we stop spending resources?
This turns reporting into strategy.
Final takeaway
The right content distribution metrics are the ones that help you make better decisions.
Views matter.
But views alone aren't a strategy.
If you want to understand how your current content could be measured and distributed more effectively, book a call with Pervasive Clipping.
We'll help you identify the metrics that actually matter for your campaign and show you how we use performance data to improve distribution.
